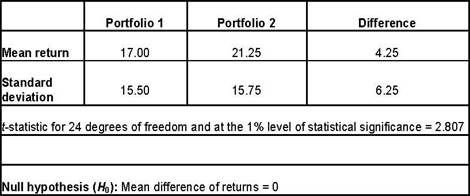
Using the following sample results drawn as 25 paired observations fTom their underlying distribution s, test whether the m ean retu rns of the two porte'olios differ from each other at the 1% level of statistical significance. Assume th e underlying distributions of returns for each portfolio are normal and that their population variances are not known.

Based on the paired comparisons test of the two portfolios, the most appropriate conclusion is that HL should be:
A.Accepted because the computed test statistic is less than 2.807.
B.Rejected because the computed test statistic exceeds 2.807.
C.Accepted because the computed test statistic exceeds 2.807.
参考答案与解析:
-
相关试题
-
Using the following sample results drawn as 25 paired observations from their underlying istribution
-
[单选题]Using the following sample results drawn as 25 paired observations from the
- 查看答案
-
Using the sample results given below, drawn as 25 paired observations from their underlying distribu
-
[单选题]Using the sample results given below, drawn as 25 paired observations from
- 查看答案
-
An analyst collects the following data related to paired observations for Sample A and Sample B. Ass
-
[单选题]An analyst collects the following data related to paired observations for S
- 查看答案
-
The following ten observations are a sample drawn from a normal population: 25, 20, 18, -5, 35, 21,
-
[单选题]The following ten observations are a sample drawn from a normal population:
- 查看答案
-
The following 10 observations are a sample drawn from an approximately normal population:<br />
-
[单选题]The following 10 observations are a sample drawn from an approximately norm
- 查看答案
-
The following ten observations are a sample drawn from an approximately nomlal population:<br /&g
-
[单选题]The following ten observations are a sample drawn from an approximately nom
- 查看答案
-
The following ten observations are a sample drawn from a normal population: 25,20,18, -5,35, 21, -11
-
[单选题]The following ten observations are a sample drawn from a normal population:
- 查看答案
-
The following 10 observations are a sample drawn from an approximately normal population<br />
-
[单选题]The following 10 observations are a sample drawn from an approximately norm
- 查看答案
-
The following 10 observations are a sample drawn from a normal population: 25,20,18, -5,35,21,-11,8,
-
[单选题]The following 10 observations are a sample drawn from a normal population:
- 查看答案
-
A sample of 100 observations drawn from a normally distributed population has a sample mean of 12 an
-
[单选题]A sample of 100 observations drawn from a normally distributed population h
- 查看答案
